Vr Mapping |
ON-LINE REFERENCE DOCUMENTATION CARDINAL SYSTEMS, LLC |
Simultaneous Bundle Block Adjustment
Type: Utility accessed from VR Air Trig
The VR bundle adjustment produces optimized camera positions and orientations form measurements of common points in the images.
It can be run as free network adjustment or full adjustment. The free network adjustment ignores control and GPS inputs in order to access the consistency and sufficiency of the image tie points. The full bundle incorporates all inputs.
Contents:
Bundle Report, Intersection Details
Bundle Report, Points Adjusted
Bundle Report, Points Unadjusted
The bundle parameters window:
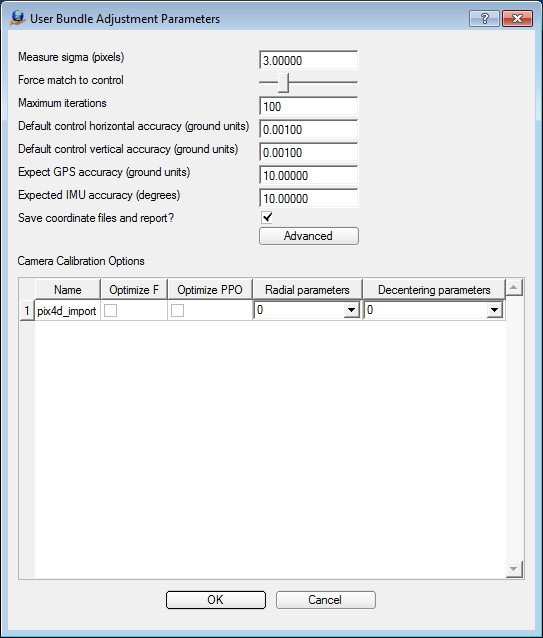
Measure sigma (pixels): This is the estimate standard deviation of the image measurements in pixels. Pixels are used for the unit because they are universal. Human operators, feature matching and template matching (e.g. cross correlation) all have predictable measurement standard deviations in pixels. Millimeters is less consistent because pixel size range from 1-30+ microns. 1.0 is the default and typically works well. For challenging imagery or uncalibrated cameras 2-4 may be more appropriate.
Force to match control: This slider changes how manual points are weighted. Hence, in a manually tied project it has little effect. In and auto tied project sliding it to the right has the affect of redistributing error from manual points to auto tie points. As most manual points tend to be control points it also has the affect of making the block match the control more closely. When all the way to the left manual and auto tie points are weight identically. It raises exponentially as it is moved right until manual points are weight 1000 times more heavily than auto ties.
Maximum iterations: The maximum iterations the bundle will run. The default is 100, and is typically sufficient.
Default control horizontal accuracy (ground units): An estimate of the standard deviation of the measured control points in the X and Y axis directions. Is common practice to set this to near zero (e.g. 0.001). In most bundle software, this is not recommended, however it works well here. For more information see the discussion of check points.
Default control vertical accuracy: An estimate of the standard deviation of the measured control points in the Z axis direction. Is common practice to set this to near zero (e.g. 0.001). In most bundle software, this is not recommended, however it works well here. For more information see the discussion of check points.
Expected GPS accuracy (ground units): An estimate of the standard deviation of the airborne GPS (all three axes). It is usually better to estimate too high rather than too low.
Expected IMU accuracy (degrees): An estimate of the standard deviation of the airborne IMU data in degrees. This applied to the combined total rotational difference.
Save Coordinate files and report? Three reports of the ground coordinate data are generated if this is checked (Intersections Details, Points Adjusted, and Points Unadjusted). For large blocks this can take time. Hence, the option is given to not write the reports.
Camera Calibration Options
There will be a row in the camera calibrations options table for each camera in the project. The parameters below are available for each camera separately in its respective row.
Optimize F |
If checked the focal length of the camera will be optimized as a variable in the bundle adjustment |
|
Optimize PPo |
If checked the principal point offsets will be optimized as variables in the bundle adjustment |
|
Radial Parameters |
The number radial distortion parameters that will be optimized as variables in the bundle adjustment. Using three is typical. Leaving it zero disables calibration of these parameters. |
|
Decentering Parameters |
The number of decentering parameters that will be optimized as variables in the bundle adjustment. Using two is typical. Leaving it zero disables calibration of these parameters. |
Advanced Bundle Parameters
Users can access the advanced bundle parameters by clicking on the 'Advanced' button on the bundle parameters window.
Statistical Significance Level: While building a set of initial values for the camera positions and orientations there are various statistical test that are done. For example: Are the number of outliers in these two solution significantly different? This parameter controls how significantly different they must be. It has no effect on a bundle that already has initial values (as from airborne GPS and IMU).
Max Blunder Percent: While building a set of initial values for the camera positions and orientations there are various intermediate adjustments. This variables declares any intermediate solution with too many outliers to be unsatisfactory. It has no effect on a bundle that already has initial values (as from airborne GPS and IMU).
Max RANSAC trials: Variations of the RANSAC algorithm are used to detect and exclude blunders while building initial values for the bundle. This limits how long they will run to avoid infinite searches.
Image Measurement Max radius: This parameter is used when dealing with high distortion images. It allows user to exclude date near the image edges starting at the corners and working inward in concentric rings. The value is in percent and is the maximum percent of the distance from center of the image to the corner for data included in the adjustment. See drawing below.
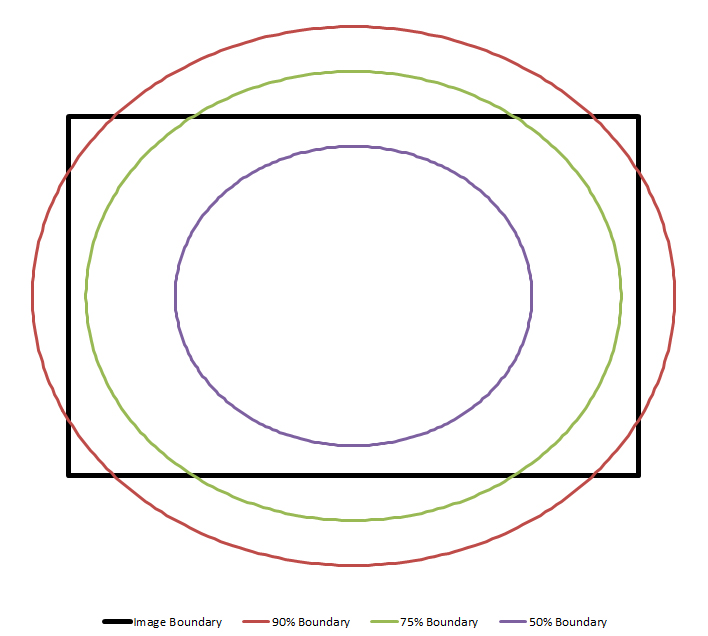
From the image above, observe that an 75-90% setting only cuts out the corners.
The highlights report attempts to put all the information that a user needs to determine if a block is satisfactory in a single fairly short report. The information is not comprehensive, and review of the other reports may be necessary.
Section 1: Control Fit
The area provides fairly comprehensive reporting of the control point residuals
When talking about control point residuals the report refers to 'Bundle' and 'Check' residuals. 'Bundle residuals' are the residuals that have been historically listed in bundle reports. They report how far a point's coordinates moves in the adjustment. The information is not irrelevant but it can be difficult to interpret because it is very closely linked to the users horizontal and vertical control accuracies (see bundle parameters). As these parameters approach zero the control bundle residuals will approach zero. This happens regardless of any other data in the adjustment. The effective result of this is that users can easily force the residuals to zero, and finding the best parameter setting that accurately reflects reality can be challenging even for experienced users. To help with this 'Check' residuals are reported. Check coordinates are calculated after the bundle has run by intersecting the image measurements of each control point and comparing the result to the pre-adjustment control point coordinates. These coordinates cannot be forced to zero, and are much better predictors of how well stereo models will match the control coordinates. Many VR users have reported that they quickly start ignoring the control bundle residuals in favor of the check coordinates.
| • | 'Control Points With Probable Blunders' - Is a list of control points whose bundle coordinates moved significantly. The means that at least one of the axis coordinates moved more than three times the user specified accuracy estimate. |
| • | 'Control RMSE in ground units' - The root mean square error (RMSE) of the control points motion in the bundle adjustment. Is is broken down by axis. |
| • | 'Greatest control residuals in ground units' - The greatest magnitude motion of any control point broken down by axis. |
| • | 'Residuals Table (ground units)' - All of the control point residuals are listed in the table. They are listed in descending order by the significance of their bundle residuals. Which means the point with the most improbably large bundle residuals is listed first. The point with the second most improbably large residual is listed second, and so on. |
Section 2: Bundle Residuals
This area provides a statistical summary of the bundle image measurement residuals.
| • | Point counts are given by the number of rays and by point type (control, manual, cross strip auto tie, and along strip auto ties). |
| • | RMSE for image measurements are broken down by point type (control, manual, cross strip auto tie, and along strip auto ties). |
| • | The distribution of 2D measurement residuals is summarized by percentiles of all points and controls points. |
| • | The worst control image space residuals are listed. |
| • | Model mapping precision is predicted. |
| • | The parameters used in the bundle adjustment are recorded. |
This report provides a detailed break down of how well the bundle matched the control. The data is reported first in ground units and then in ground sample distance (GSD) units. Reporting in GSD units is useful in a way analogous to how using pixels for image measurement is useful. That is to say that, there are fairly predictable expected root mean square errors (RMSE) in the horizontal and vertical axes for nadir looking images. The horizontal RMSE should be around 0.25-0.75 GSD, which means the largest horizontal residuals should be around 1.5-2.25 GSD. The vertical axis is not as precise, and the RMSE should be around 0.5-1.25 GSD. This implies that the maximum vertical errors should be around 1.5-3.75 GSD. While these ranges will generally hold they do represent a floor to expected errors. If the imagery is noisy, compressed, has motion blur, is poorly focused, is excessively light or dark, is not nadir looking, the camera is poorly calibrated, or the camera is unstable then the general rules presented here will not hold.
The amount of data is reported at the top of this report. Total image point counts are given first and then the inlier/outlier breakdown. Following that is a breakdown of the inliers by the number of observations rays.
Residual Summary Stats (Pixels)
The inlier/outlier counts and measurement RMSE are given by point type (control, manual, cross strip, and auto tie). Following that is a breakdown of the 2D residual vector lengths by percentile. These percentiles are useful for choosing thresholds for cleaning away auto ties.
Individual Point Residuals (Pixels)
In the first part of this section, "Sorted Control Residuals", all of the control residuals are listed in descending order from the point with the largest residuals to the point with the least. In the second section, "Sorted Residuals", the worst residuals are listed (also in descending order). Up to 1000 measurements are listed in the section section. Capping the number of points prevents a slow sorting of hundreds of thousands of points in large blocks.
The EO fit report documents how much the measured EO parameters moved during the adjustment. Delta X, Y, and Z document how far the measured camera positions moved. The "Position Delta" is the combined offset vector length, sqrt(DeltaX^2 + DeltaY^2 + DeltaZ^2). The angular delta are given similarly; they are first broken down by axis and then given as a combined single magnitude. In the case of rotations, the combined magnitude is the smallest single rotation about any direction vector that transforms from the measured to the final rotation.
The ExtOri report is an ISAT format exterior orientation file. It lists the EO data for each image, one image per line. The column values are image name, x coordinate, Y coordinate, Z coordinate, omega (rotation about the X-axis), phi (rotation about the once-rotated Y axis), and kappa (rotation about the twice-rotated Z-axis). The EO values in this report are what generally constitutes the 'results' of the adjustment. They are imported to set models for mapping, create ortho photos, produce DSMs, etc. This report is, therefore, primarily intended to be machine readable.
Bundle Report, Intersection Details
The Intersections Details reports lists statistics for the solutions for the 3D coordinates of all the points in the bundle adjustment. This can be a long list of points and take a long time to write. For this reason writing this report can be disabled using the the "Save coordinate files and reports" check box of the bundle parameters.
Data for each point
| • | Point name |
| • | Number of image measurements (Rays) |
| • | Number of inlier image measurements (Used) |
| • | Best intersection angle list the intersection among the image rays that is closest to 90 or 270 degrees. This is a simple way to picture the strength of intersection geometry of the rays. |
| • | X, Y, and Z coordinates |
| • | Propagated standard errors for the X, Y, and Z coordinates (sX, sY, and sZ) |
Bundle Report, Points Adjusted
The adjusted points report is a simple list of the calculated 3D coordinates of the all the points in the adjustment. It is formatted as a VR control file so that it can be directly used in other VR modules (e.g. ortho photo or model set). The control coordinates in this report are the adjusted coordinates from the bundle.
Bundle Report, Points Unadjusted
The adjusted points report is a simple list of the calculated 3D coordinates of the all the points in the adjustment. It is formatted as a VR control file so that it can be directly used in other VR modules (e.g. ortho photo or model set). The control coordinates in this report are unaltered from the original input into the bundle.
Constraints are additional measurement data added to the bundle. VR Adjust currently supports adding distance constraints between points and between images. If there are constraints, statistics of their fit in adjustment are in this report.