Vr Mapping |
ON-LINE REFERENCE DOCUMENTATION CARDINAL SYSTEMS, LLC |
Bundle, Interactive
The interactive bundle adjustment is intended for close range applications and blocks with manual measurements. It is useful for isolating issues and finding miss measurements.
Details regarding bundle parameters and reports are given elsewhere and are not repeated here. This subject covers how to use the step-by-step interactive GUI only.
Relative Orientation Parameters
Statistically Similar Solutions (SSS)
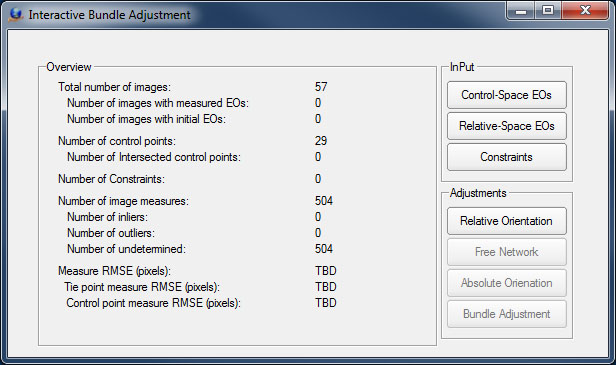
The main bundle interactive window or overview window is shown above. The block statistics are shown in the left box and input and processing options are on the right.
The block statistics or overview, shows the current status of the block. The first section of data deals with images. It shows the number of total images, the number of images that have measured exterior orientations (EOs), and the number of images that have initial values for the bundle adjustment. If a block has measured EOs then users can skip directly to bundling. If not it is necessary to follow the workflow to build a set of initial values. In the image above, it shows that there are no images with initial EOs. This indicates that no work has been done, and the building the initial values must begin with a Relative Orientation.

In the overview shown above there are now initial values for 41 of the 57 images. Further, most of the control points are now defined (intersected). Note that the Free Network, Absolute Orientation, and Bundle Adjustment buttons are active. The active buttons indicate that the three operations can be performed with the subset of the data that is currently active (has initial values).
The input box is in the top right of the overview window. Is used to restart processing at saved intermediate solutions, and to enter constraints.
The top two buttons are functionally very similar. When clicked, the user is prompted to select a bundle exterior orientation report (...BundleReportExtOri.txt). This report contains previous solutions and allows the block to be restored to previous states. "Control-Space" refers to solutions that are done after absolute orientation and are thus in the coordinate systems of the control. Using this button tells the software to enable the Bundle Adjustment option instead of just the Free Network.
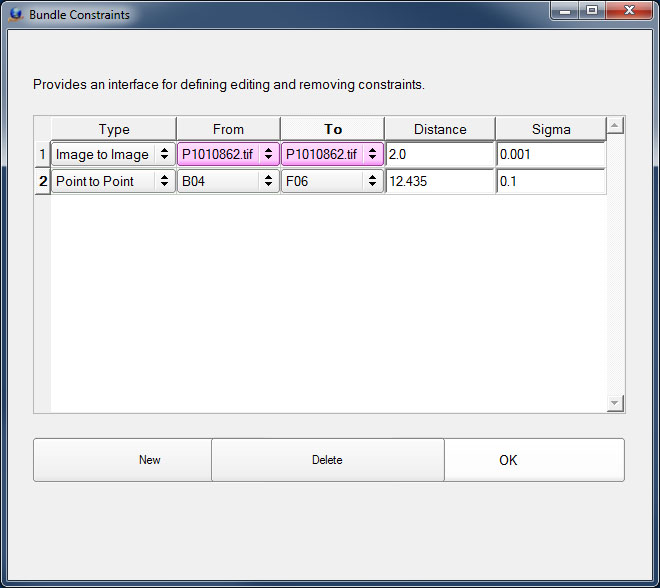
The Constraints button is used to define distance constraints between points or images. The interface is shown below. Note that in the absence of control points these constraints define part of the coordinate system. Hence, leaving all of them loosely defined can leave part of the coordinate system loosely defined and solutions unstable. For that reason one of the distance constraints is shown with a small sigma below. It is good practice to hold at least one distance tightly define in the absence of control points.
The buttons in the right-bottom section imply a work flow. The nominal work flow is:
| 1. | Run relative orientations and choose one to be the start of the block. |
| 2. | Run free network adjustments on growing numbers of images at least until there is enough control data to do an absolute orientation. |
| 3. | Run bundles on growing numbers of images until complete. |
The workflow, however, is not as rigid as that implies. Users can, for example:
| 1. | Restart anytime by returning to select a new relative orientation (starting image pair). |
| 2. | Run free works even after transforming to Control Space (this can be useful for diagnosing issue with control measurements). |
| 3. | Re-run absolute orientation as they desire to redo control alignments. |
| 4. | Remove images from the active set (using controls in Free Network and Bundle interfaces). |
| 5. | Use the input buttons on the overview to restart or merge sub-blocks by importing multiple EO files. When importing multiple files care should be taken to make sure they are in the same coordinate system. In general this can only be done by import control-space EOs. |
Block building begins by doing relative orientations. The relative orientation interface is designed to allow users to:
| 1. | Process many pairs of images |
| 2. | Compare solutions statistics |
| 3. | Choose a pair as the beginning point for the new block |
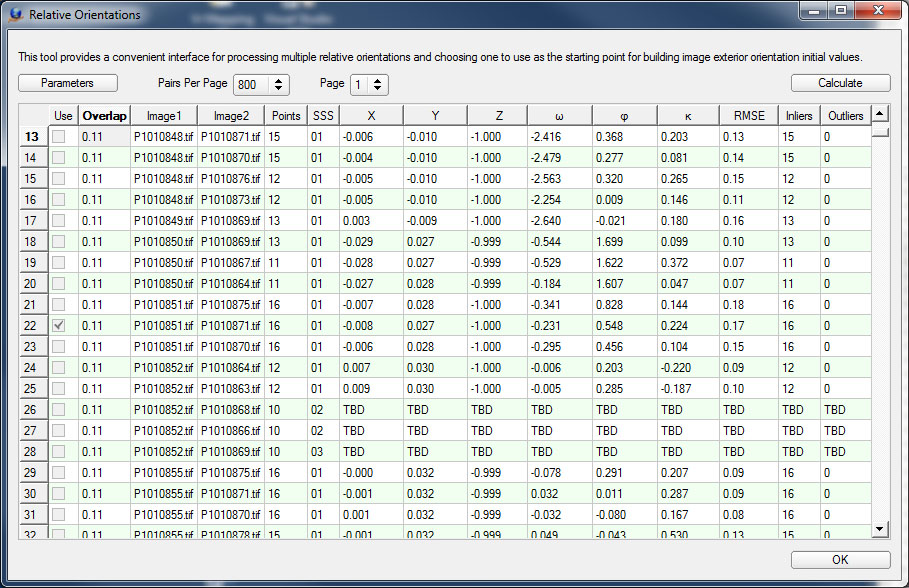
In order process the relative orientations make a selection from the listed pairs of images by drag or clicking on the row numbers to select them (see image below). Note that ctl-click and shift-click also work for making selections. In large projects there are frequently thousands of potential pairs of starting images. The "Pairs Per Page" and "Page" combo boxes can be used to navigate through them. However, this is rarely necessary because the most likely pairs to be useful are sorted to be near the top.

The "Calculate" button near the top right will then run all the selected relative orientations and populate the table with values (see below). The relative orientation is expressed as a unit vector from Image1 to Image2 and the Euler anlges rotations between the images (omega, phi, and kappa). The number of points, root mean square error in pixels (RMSE), and the number of inliers and outliers are listed. Rows with SSS > 0 have To Be Determined stats, this is discussed below.

Good choices to "Use" for the starting relative orientation have stable solutions (SSS =1), low RMSE ( < 1.0), and few outliers. Row 22 was chosen below (by check the box) because it meets these criteria. Click "Ok" in the bottom right to finalize the selection and close the window.
Relative Orientation Parameters
The Relative orientation parameters can be accessed by clicking the "Parameters" button near the top left of the window.
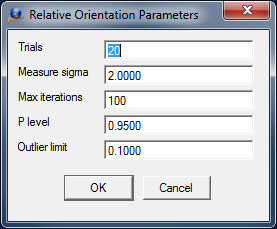
Trials |
Relative orientation uses a RANSAC method to find robust solutions. This parameters is a limit to how many times the solution will start over. The higher the number the harder the algorithm looks for solutions, but the slower it goes. Typical values range from 5-100 depending on how many outliers are expected in the data.
|
Measure sigma |
Predicted measurement standard error in pixels. Typical values range from 0.5 - 2.0.
|
Max iterations |
Limit on the number of iterations for optimizing relative orientations solutions
|
P Level |
Searching for solutions includes asking various questions (e.g. is this solution better than that solution?). These questions are statistical and P Level is level at which they must be significant in order to answered a specific way. Typical values range 0.9-0.99.
|
Outlier limit |
This is threshold for how much of the data can be classified as outliers in acceptable solutions. If set to 0.1 at most 10% of data can be outliers. Typical values range from 0.0-0.5. |
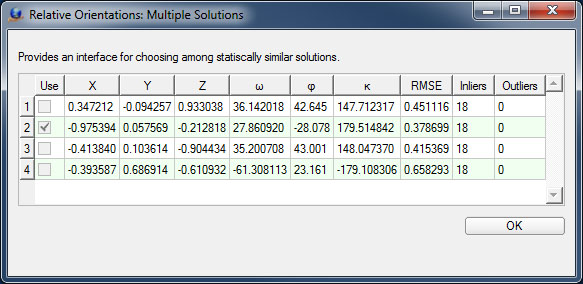
Statistically Similar Solutions (SSS)
When determining relative orientation it is possible to find multiple solutions. Theoretically this indicates that points are near to some critical geometry. However, the shape of those geometries is complex (particularly when modeling them considering measurement noise). In order to detect them the software keeps track of all statistically similar solutions it encounters while search for the optimum solution. If SSS > 1 then the image measurements alone are not enough to definitively choose a single solution (given the current parameters). Users can tell the software which solution to use. To do this double click on a SSS cell > 1. A table that lists the stats of all the similar solutions will be displayed. Clicking on the "Use" check box of a row selects a particular solution. An example of relative orientation with four SSS is given below. In this example the second row was chosen as a solution. In this case the camera motion was expected to be mostly horizontal (it is from a drone flight) which made the solution with the smallest Z component the more probable representation of the true geometry.
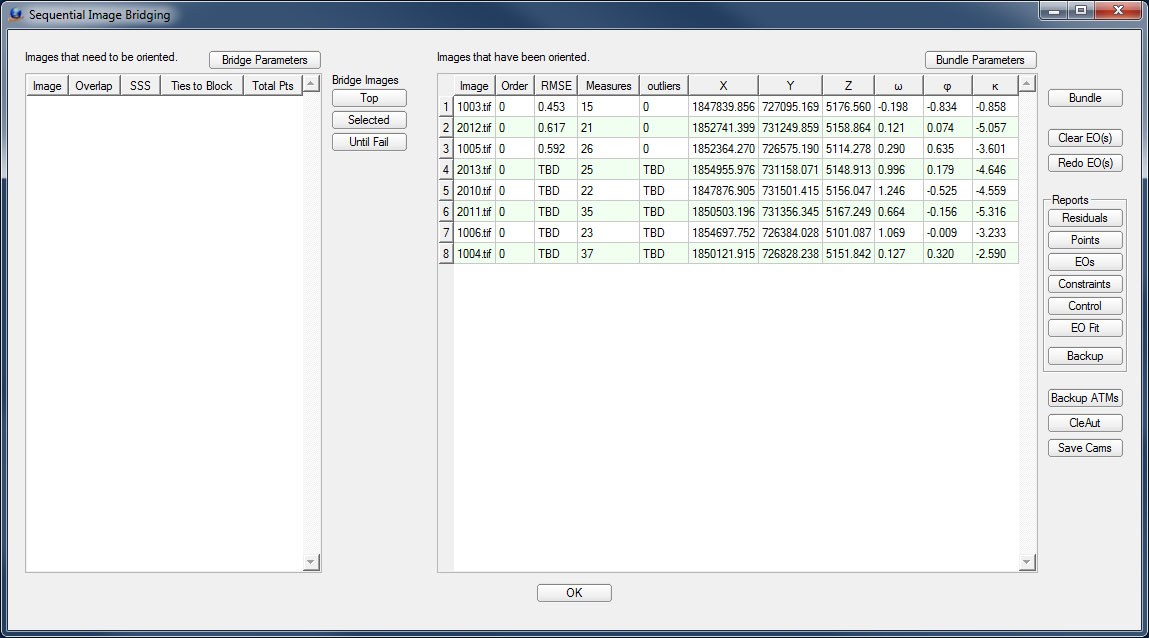
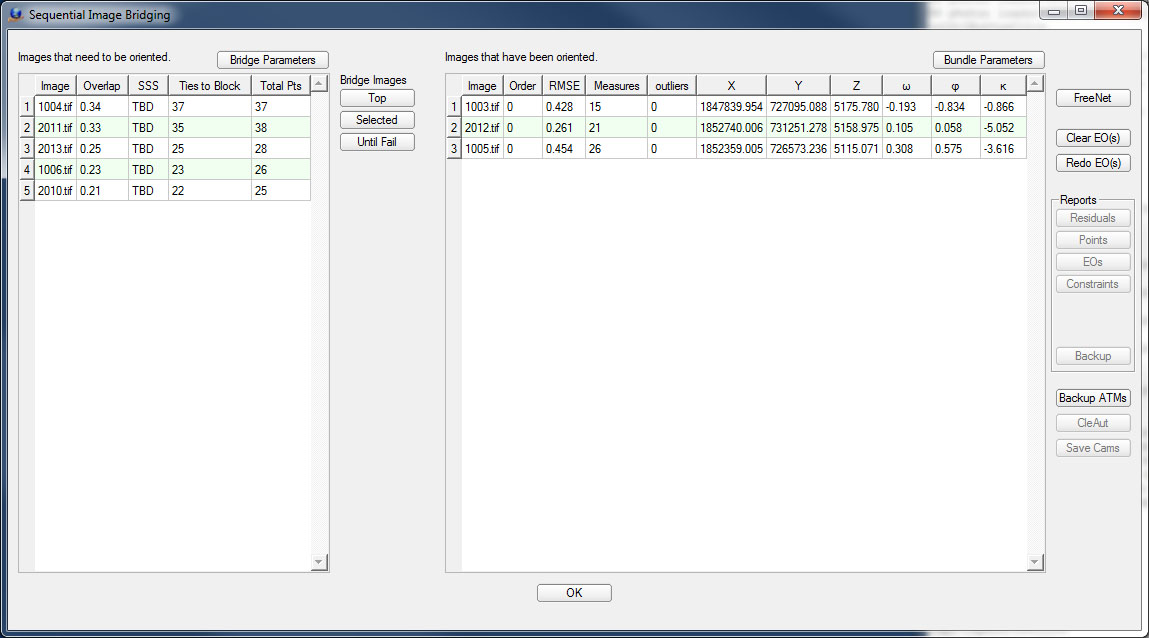
After a relative orientation is selected, the free network interface is used to build a block of images in relative space. The interface is shown below. Images that are not yet part of the relative block are shown in the table on the left. Images that have relative EOs are shown on the right. The buttons between the two tables are operations that move images from the left to the right (calculate EOs). The "Top" button calculates an EO for the top images and if successful moves it to the right table. Alternatively, users can make a selection of images in the left table by clicking/dragging the row numbers and use the "Selected" button to calculate EOs for a group of images. The final option if for the software to try to calculate EOs for all of them sequentially, the "Until Fail" button.
The buttons in the right column are divided into groups. The top button runs the optimization. The two buttons grouped below that operated on selections of images in the right table. "Clear EO(s)" moves images back to the left side (excluded them from the current solution). "Redo EO(s)" recalculates the EOs for selected images as if moving them from the left side anew. The reports group of buttons allows access to all the relevant bundle reports. The bottom group of buttons "Backup" images measurements, Clean automatic tie points, and save calibrated cameras.
The "Ok" button at the bottom middle exits the interface.
The parameters button above the left table allows access to the following parameters:
Trials |
Relative orientation uses a RANSAC method to find robust solutions. This parameters is a limit to how many times the solution will start over. The higher the number the harder the algorithm looks for solutions, but the slower it goes. Typical values range from 5-100 depending on how many outliers are expected in the data.
|
Measure sigma |
Predicted measurement standard error in pixels. Typical values range from 0.5 - 2.0.
|
Max Iterations |
Limit on the number of iterations for optimizing relative orientations solutions
|
P Level |
Searching for solutions includes asking various questions (e.g. is this solution better than that solution?). These questions are statistical and P Level is level at which they must be significant in order to answered a specific way. Typical values range 0.9-0.99.
|
Outlier Limit |
This is threshold for how much of the data can be classified as outliers in acceptable solutions. If set to 0.1 at most 10% of data can be outliers. Typical values range from 0.0-0.5. |
Stop at failed bridge |
If checked the "Until fail" option will stop at any failed attempt to find an EO for an images. Otherwise it will keeping trying on other images. |
Max intermediate bridges |
The number of images that are bridged into a solution in between bundle optimizations. |
The bundle adjustment parameters are accessed using the button above the right table.
Absolute orientation does a best fit alignment of camera positions and orientations to the control. It must be done before running the bundle adjustment. The absolute orientation button becomes active when there are at least three intersected control points in a free network adjustment. The interfaces is shown below.
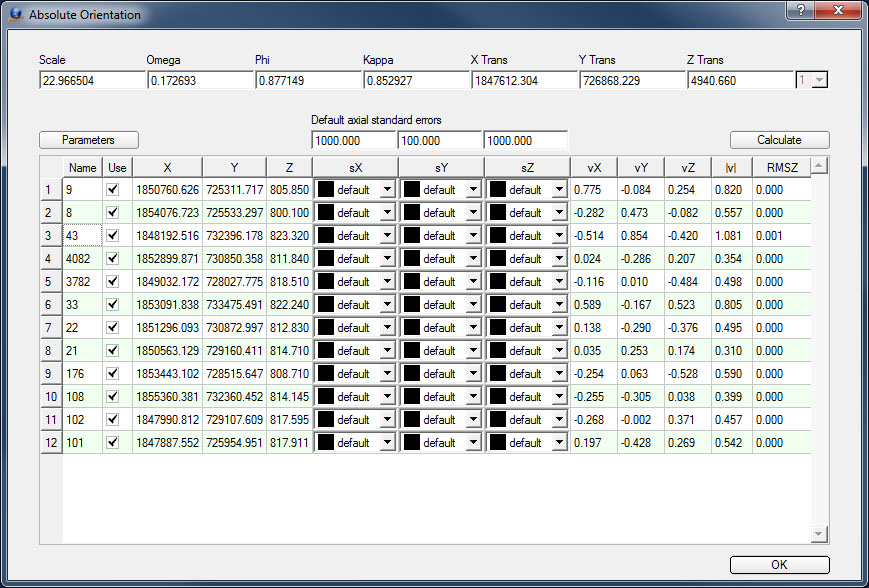
The seven parameters of the transformation are listed along the top. The "Use" check boxes enable or disable points in the adjustment. The standard errors of each of the control points in this example are set to default. The default setting indicates that the values above each column will be used. The large default values force the inclusion of every point. Smaller values would allow the transformation to exclude data that appeared to be miss measured. If changes are made to the weights or "Use" options the solution text turns pink, and the "Calculate" button must be pressed to update the solution.
Parameters are accessed by clicking the button near the top left of the interface.
Trails |
Relative orientation uses a RANSAC method to find robust solutions. This parameters is a limit to how many times the solution will start over. The higher the number the harder the algorithm looks for solutions, but the slower it goes. Typical values range from 5-100 depending on how many outliers are expected in the data. |
Z Limit |
The number of standard error lengths a solution must be in apparent error before it is excluded from the solution. |
Max Iterations |
Limit on the number of iterations for optimizing relative orientations solutions |
P Level |
Searching for solutions includes asking various questions (e.g. is this solution better than that solution?). These questions are statistical and P Level is level at which they must be significant in order to answered a specific way. Typical values range 0.9-0.99. |
Outlier Limit |
This is threshold for how much of the data can be classified as outliers in acceptable solutions. If set to 0.1 at most 10% of data can be outliers. Typical values range from 0.0-0.5. |
The block may continue to be built and bundle adjustments run after absolute orientation. The interface is almost identical to the free network interface, but a few more reports are available.